For a long time, anomaly detection was treated as a niche problem.
Something you needed only in specific industries — fraud detection at banks, intrusion detection in security teams, maybe fault monitoring in factories.
But that’s changed completely.
As modern systems become increasingly connected, automated, and data-driven, anomaly detection has quietly become one of the most important areas in artificial intelligence and machine learning.
In 2025–2026, anomaly detection is everywhere:
- cybersecurity platforms
- cloud infrastructure monitoring
- real-time financial fraud prevention
- IoT systems
- industrial monitoring
- healthcare analytics
- AI system observability
- autonomous vehicle safety
- LLM output quality control
to autonomous systems and large-scale enterprise platforms, anomaly detection is now everywhere.
The challenge is simple to describe but extremely difficult to solve:
How do we automatically identify unusual behavior before it becomes a serious problem?
In 2025–2026, anomaly detection is evolving far beyond traditional statistical methods. Modern AI systems are increasingly using:
- deep learning
- transformer architectures
- streaming analytics
- graph-based learning
- real-time inference pipelines
to detect anomalies at massive scale.
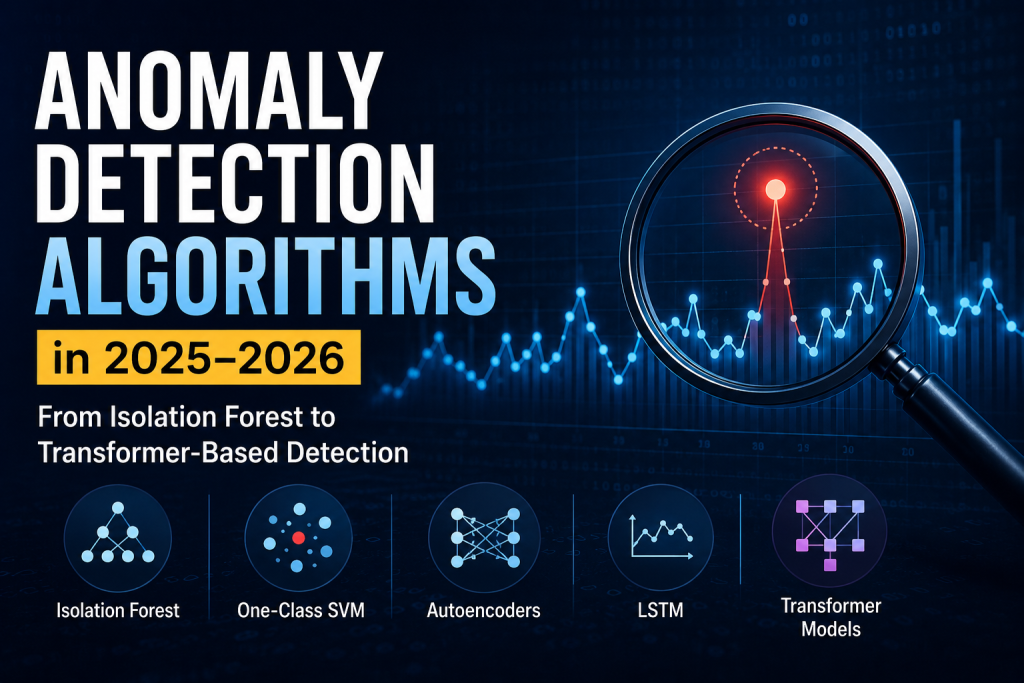
This article explores how anomaly detection algorithms are evolving, where classical methods still matter, and why transformer-based approaches are becoming increasingly important in modern AI systems.
What Is Anomaly Detection?
At its core, anomaly detection is simple:
Find the things that don’t belong.
In technical terms, it’s the process of identifying data points, patterns, or behaviors that deviate significantly from what’s expected or normal.
Sometimes those anomalies are errors.
Sometimes they’re attacks.
Sometimes they’re early warnings of something about to break.
And sometimes they’re genuinely valuable signals hiding inside noise — like an unusual customer behavior pattern that turns out to predict churn.
The challenge is that “normal” is hard to define, especially when data is messy, high-dimensional, and constantly changing.
That’s where algorithms come in.
The goal of anomaly detection systems is not simply to identify rare events.
The real goal is:
detect meaningful abnormal behavior accurately and early.Why Anomaly Detection Matters More Than Ever
The volume of data being generated today is staggering.
A single large-scale cloud system can generate:
- millions of log events per hour
- thousands of metric time-series streams
- real-time network traffic across hundreds of nodes
No human team can monitor all of that manually.
And the cost of missing an anomaly has grown.
A cyberattack that goes undetected for 48 hours can devastate a company. A manufacturing fault missed for a few production cycles can cost millions. A financial fraud pattern that slips through for a week can cause irreversible damage.
The demand for faster, smarter, more accurate anomaly detection is driving serious investment in new algorithms and architectures — and 2025–2026 is producing some genuinely interesting results.
As systems become more autonomous, anomaly detection becomes increasingly critical for:
trust, reliability, and operational safety.Types of Anomalies
Modern anomaly detection systems usually deal with three major anomaly categories.
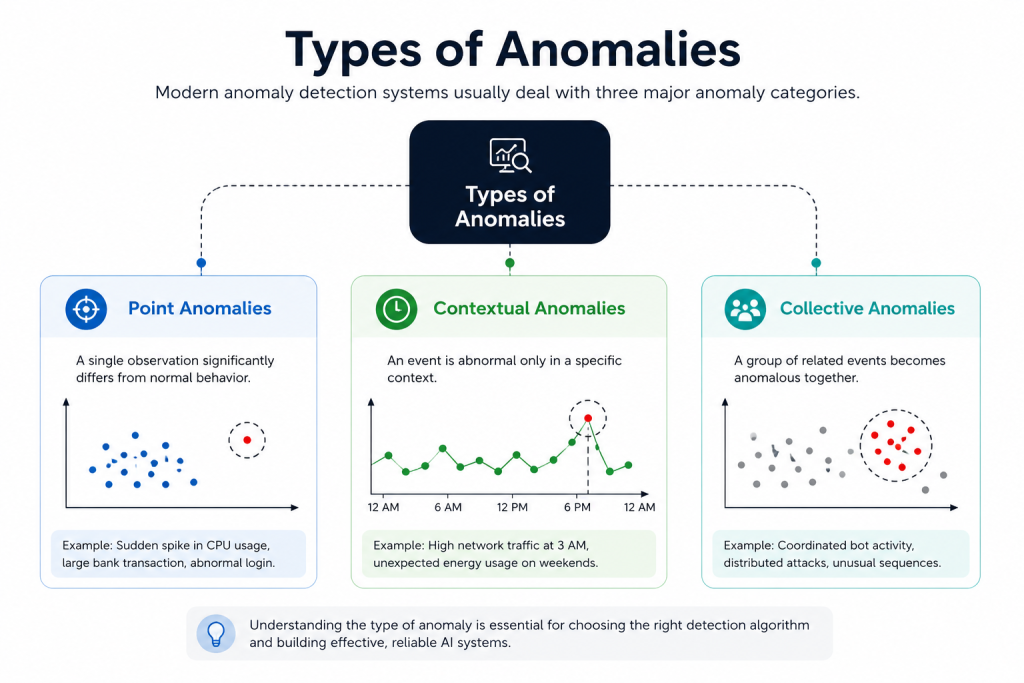
Point Anomalies A single data point that’s wildly different from the rest. Think a transaction of $50,000 in an account that normally sees $200 purchases. This is the most common type and the easiest to detect.
Example:
- sudden spike in CPU usage
- unusually large bank transaction
- abnormal login attempt
Contextual Anomalies A data point that looks normal in isolation but is strange given its context. A temperature reading of 30°C is normal in summer but suspicious in January in northern Canada. Context matters enormously here.
Example:
- high network traffic at 3 AM
- unexpected energy usage during weekends
The value itself may not be abnormal, but the context makes it suspicious.
Collective Anomalies A group of data points that are individually normal but collectively suspicious. No single network packet looks malicious, but the pattern of a thousand packets over five minutes tells a different story.
Example:
- coordinated bot activity
- distributed cyberattacks
- unusual sequences in manufacturing systems
These are often harder to detect because individual events may appear normal in isolation.
Most real-world systems have to deal with all three — which is part of what makes anomaly detection genuinely hard.
Classical Anomaly Detection Algorithms
Despite rapid advances in deep learning, classical anomaly detection algorithms are still extremely important in 2025–2026. Many of them are still highly effective today.
Why?
Because many traditional methods remain:
- efficient
- interpretable
- lightweight
- easier to deploy
especially for structured data systems.
Z-Score Detection — The Statistical Foundation That Still Holds Up
Z-Score detection is one of the oldest anomaly detection techniques in existence.
And in 2025–2026, it’s still running in production systems at some of the largest companies in the world.
That tells you something.
Before neural networks, before ensemble methods, before anyone used the phrase “machine learning” in a job description — statisticians were already using Z-Scores to find what didn’t belong.
The fact that it’s survived this long isn’t nostalgia.
It’s because the core idea is genuinely sound.
The Idea Behind It
Z-Score answers one simple question:
How many standard deviations away from the mean is this data point?
That’s it.
The formula is:
X  = the data point
μ  = mean of the dataset
σ  = standard deviation of the dataset
A Z-Score of 0 indicates the point is exactly at the mean.
A Z-Score of 2 means it’s two standard deviations away.
A Z-Score of -3 indicates it’s three standard deviations below the mean.
The further from zero, the more unusual the point.
Most implementations use a threshold — commonly 2.5 or 3 — where anything beyond that threshold gets flagged as an anomaly.
|Z| > 3  →  anomaly
|Z| ≤ 3  →  normal
Simple. Interpretable. Fast.
Why It Actually Works
The reason Z-Score detection holds up is rooted in a fundamental statistical property.
In a normal distribution:
- ~68% of data falls within 1 standard deviation of the mean
- ~95% falls within 2 standard deviations
- ~99.7% falls within 3 standard deviations
That last number is the key.
If a data point sits beyond 3 standard deviations from the mean, there’s only a 0.3% chance it belongs to normal behavior.
That’s a strong signal — and it requires zero training, zero labeled data, and almost zero compute.
For a lot of real-world monitoring problems, that’s more than enough.
Where Z-Score Detection Shines
Financial transaction monitoring A customer who normally spends $150 per transaction suddenly submits one for $8,000. The Z-Score spikes immediately. No model training needed — the statistical deviation does the work.
Server and infrastructure metrics CPU usage, memory consumption, request latency — these metrics tend to be relatively stable under normal conditions. A sudden spike that pushes a Z-Score past 3 is a reliable early warning signal.
Manufacturing quality control Measuring product dimensions, weight, or temperature during production. Any reading that deviates significantly from the process mean gets flagged for inspection before it becomes a defect.
Scientific and research data Identifying outlier measurements in experimental data — sensor errors, recording mistakes, genuinely unusual observations — before they skew downstream analysis.
Ideal for: univariate monitoring, real-time alerting, financial metrics,
infrastructure dashboards, quality control pipelines
The Honest Limitations
Z-Score detection works well under specific conditions.
When those conditions aren’t met, it struggles — sometimes badly.
It assumes normally distributed data
This is the big one.
Z-Scores are built on the assumption that your data follows a Gaussian distribution — the classic bell curve. A lot of real-world data doesn’t.
Network traffic, financial returns, user behavior data — these are often skewed, heavy-tailed, or multimodal. Applying Z-Score detection to non-normal data produces unreliable results.
It’s sensitive to extreme outliers
Here’s an ironic problem: anomalies themselves can distort the mean and standard deviation used to calculate Z-Scores.
A massive outlier pulls the mean toward it and inflates the standard deviation — which can actually make other genuine anomalies look more normal than they are.
This is sometimes called the masking effect.
It only works on univariate data
Standard Z-Score detection evaluates one variable at a time.
But real anomalies are often multivariate — a combination of slightly unusual values across multiple metrics that individually look fine but together signal a problem.
A server might have normal CPU, normal memory, and normal latency — each one individually unremarkable. But the specific combination of all three being elevated simultaneously is the actual signal.
Z-Score misses that entirely.
It struggles with seasonal and trending data
If your data has a natural daily cycle — traffic that peaks at noon and drops at midnight — a Z-Score calculated over the full dataset will flag normal peak behavior as anomalous.
You need to account for seasonality and trend before applying Z-Score detection, which adds complexity.
The Modified Z-Score — A More Robust Version
Because the standard Z-Score is sensitive to extreme outliers corrupting the mean, a more robust variant is often used in practice:
The Modified Z-Score replaces mean and standard deviation with median and Median Absolute Deviation (MAD) — both of which are far less affected by extreme values.
Modified Z = 0.6745 × (X - median) / MADThe 0.6745 constant scales the result to be consistent with standard Z-Scores for normally distributed data.
This version holds up much better in messy, real-world datasets where a few extreme values would otherwise throw off the entire calculation.
In 2025–2026, when people refer to Z-Score anomaly detection in production systems, they’re often actually using the modified version.
Use Modified Z-Score when: your data is noisy, contains extreme outliers,
or you can't guarantee a clean Gaussian distribution
Z-Score in Streaming and Real-Time Systems
One area where Z-Score detection remains genuinely hard to beat is real-time monitoring.
Because it requires only two values — mean and standard deviation — it can be updated incrementally as new data arrives.
This makes it highly efficient for:
- streaming data pipelines
- real-time dashboards
- edge devices with limited compute
- high-frequency alerting systems
Using rolling or exponentially weighted Z-Scores — where the mean and standard deviation update continuously based on recent data — makes it adaptive to gradual shifts in normal behavior over time.
python
# Conceptual rolling Z-Score logic
rolling_mean = data.rolling(window=100).mean()
rolling_std  = data.rolling(window=100).std()
z_score      = (data - rolling_mean) / rolling_std

anomalies = data[abs(z_score) > 3]
This pattern is running inside monitoring tools at scale right now — because it’s fast, cheap, and interpretable.
How Z-Score Fits Into Modern Anomaly Detection Pipelines
Z-Score detection rarely runs alone in mature production systems.
Instead, it often plays a specific role inside a larger pipeline:
As a fast first-pass filter Z-Score quickly eliminates obviously normal data, reducing the volume that more expensive models need to evaluate.
As a baseline for comparison New anomaly detection models are often benchmarked against Z-Score performance. If your fancy deep learning model can’t consistently beat a Z-Score baseline, that’s a signal worth paying attention to.
As a complementary signal in ensembles Combining Z-Score flags with Isolation Forest scores and autoencoder reconstruction errors in an ensemble often outperforms any individual method — and Z-Score contributes especially well on clean, univariate metrics.
As an explainability layer Even when a complex model makes the primary detection decision, Z-Scores on individual features can help explain which specific values contributed to the anomaly.
Isolation Forest — Still One of the Best
Introduced by Fei Tony Liu in 2008, Isolation Forest remains one of the most widely used anomaly detection algorithms in production systems — and for good reason.
The intuition behind it is elegant:
Anomalies are easier to isolate than normal points.
The algorithm builds random decision trees by repeatedly splitting data on random features at random thresholds. Normal data points, which tend to cluster together, require many splits to isolate. Anomalies — being rare and different — get isolated quickly with very few splits.
A short path through the tree = anomaly. A long path through the tree = normal.
Why it still works in 2025–2026:
- handles high-dimensional data well
- computationally efficient at scale
- doesn’t require labeled training data
- works well out of the box with minimal tuning
Where it struggles: It can miss contextual and collective anomalies because it evaluates points individually. It also doesn’t perform as well when anomalies are clustered or when the data has complex dependencies.
Ideal for: tabular data, fraud detection, network intrusion, server metricsZ-Score vs Isolation Forest — When to Use Which
A question that comes up often:
If Isolation Forest is more powerful, why use Z-Score at all?
The answer comes down to three things: speed, interpretability, and simplicity.
| Factor | Z-Score | Isolation Forest |
|---|---|---|
| Training required | No | Yes |
| Compute cost | Very low | Low-Medium |
| Interpretability | Very high | Medium |
| Handles non-normal data | Poorly | Well |
| Multivariate support | No (standard) | Yes |
| Real-time streaming | Excellent | Good |
| Ease of implementation | Very easy | Easy |
If you need to explain to a non-technical stakeholder exactly why a specific data point was flagged — Z-Score gives you a clean, understandable answer.
“This transaction had a Z-Score of 4.7 — it was nearly 5 standard deviations above the average transaction value” is something anyone can grasp.
Isolation Forest’s anomaly score doesn’t have that kind of intuitive explanation.
One-Class SVM — The Boundary Builder
One-Class Support Vector Machine takes a different approach.
Instead of comparing points to each other, it tries to learn a tight boundary around normal data. Anything that falls outside that boundary gets flagged as an anomaly.
It works well when:
- you have clean, labeled “normal” data to train on
- your anomalies are genuinely far from normal behavior
- the feature space is relatively low-dimensional
The main limitation in 2025–2026 is scalability. One-Class SVM doesn’t handle massive datasets well, and tuning the kernel and hyperparameters requires real expertise.
That said, for smaller, well-defined problems — medical sensor data, equipment monitoring in controlled environments — it’s still a solid choice.
Ideal for: controlled environments, medical diagnostics, equipment fault detectionDBSCAN — Density-Based Outlier Detection
DBSCAN (Density-Based Spatial Clustering of Applications with Noise) wasn’t originally designed for anomaly detection.
But it turned out to be excellent at it.
The idea is straightforward: normal data tends to cluster in dense regions. Points that don’t belong to any dense cluster get labeled as noise — which in anomaly detection terms means “outlier.”
What makes DBSCAN useful:
- doesn’t require you to specify the number of clusters in advance
- naturally identifies anomalies as noise points
- handles irregular cluster shapes well
Where it falls short: It struggles badly with high-dimensional data and variable-density datasets. And it requires careful tuning of two key parameters — epsilon and minimum samples — that can dramatically change results.
Ideal for: geospatial anomaly detection, network traffic clustering, customer behavior analysisHow Deep Learning Changed Anomaly Detection
Classical algorithms are powerful, but they have real limits.
They struggle when:
- data is sequential and time-dependent
- patterns are complex and multi-dimensional
- normal behavior shifts gradually over time
- the anomalies are subtle and contextual
Deep learning changed the game by learning representations of data directly — without needing hand-crafted features.
This opened up a new class of anomaly detection approaches that can handle far more complex problems.
Autoencoders — Teaching AI What Normal Looks Like
Autoencoders are neural networks trained to compress data into a smaller representation and then reconstruct it back to its original form.
Input → Encoder → Compressed Representation → Decoder → Reconstructed OutputThe key insight for autoencoder anomaly detection:
If you train an autoencoder only on normal data, it gets very good at reconstructing normal data. When it sees an anomaly, it can’t reconstruct it well — and the reconstruction error spikes.
That reconstruction error becomes your anomaly score.
High error = something unusual. Low error = normal data.
Why autoencoders are popular in 2025–2026:
- work well with images, time-series, tabular, and text data
- can capture complex non-linear patterns
- scale reasonably well
- don’t need labeled anomaly examples during training
The catch: If your training data contains anomalies (which it often does in the real world), the autoencoder learns to reconstruct those too. Data quality matters a lot.
Ideal for: image anomaly detection, network intrusion, manufacturing defect detection, log analysisLSTM-Based Anomaly Detection — For Time-Series Data
Long Short-Term Memory networks were built specifically to understand sequences — data where the order and timing of events matters.
For anomaly detection in time-series data, that’s exactly what you need.
An LSTM-based detector learns the normal temporal patterns in your data:
- how metrics usually trend over time
- what normal fluctuations look like
- how values at time T typically relate to values at T-1, T-2, T-10
When something breaks that pattern, the model flags it.
This makes LSTM-based detection powerful for:
- server and infrastructure monitoring
- IoT sensor anomaly detection
- financial time-series (trading patterns, transaction sequences)
- predictive maintenance
The 2025–2026 reality: Pure LSTM models are increasingly being replaced or augmented by Transformer-based architectures for long-sequence data. But LSTMs remain highly relevant for shorter sequences and edge deployment where computational resources are limited.
Ideal for: time-series monitoring, IoT sensors, infrastructure metrics, predictive maintenanceTransformer-Based Anomaly Detection — The New Frontier
Transformers — the same architecture behind large language models — are now being applied to anomaly detection, and the results are compelling.
Models like Anomaly Transformer, PatchTST, and TimesNet have shown strong performance on benchmark time-series anomaly detection tasks.
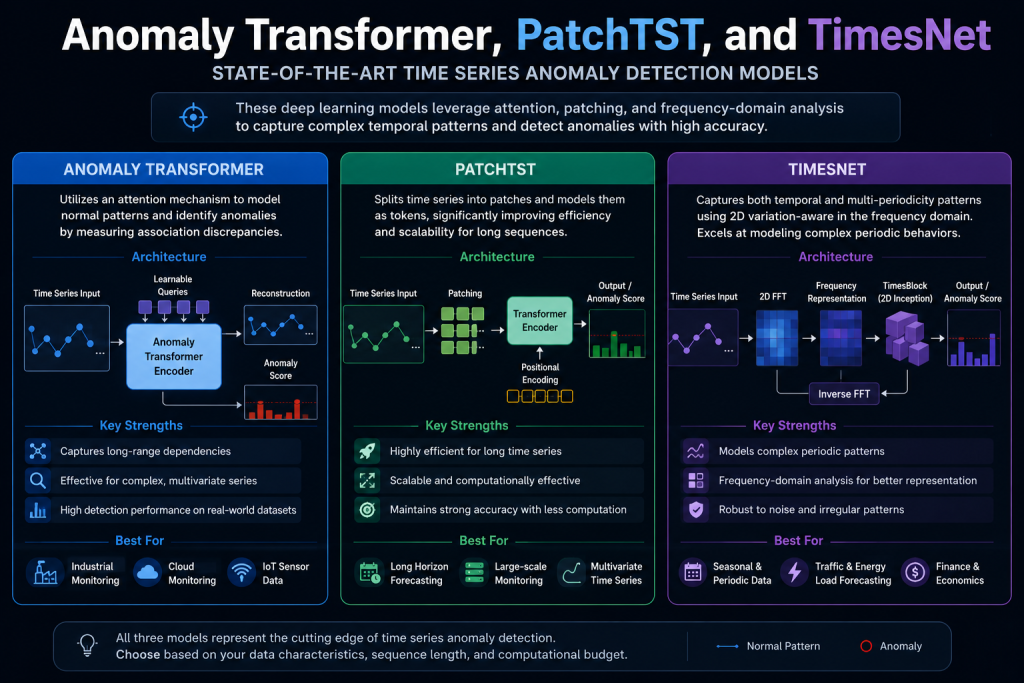
What makes Transformers well-suited for this:
- attention mechanisms can model long-range dependencies in sequences
- they handle variable-length inputs naturally
- pre-trained foundation models can be fine-tuned on specific anomaly detection tasks with relatively little data
In 2025–2026, we’re seeing a clear trend:
Foundation model fine-tuning is becoming a practical approach for anomaly detection in domains where labeled data is scarce.
Instead of training a detector from scratch, teams are fine-tuning pre-trained time-series models on their specific data — dramatically reducing the training data and compute needed.
Ideal for: complex time-series, multivariate anomaly detection, long-sequence analysis, NLP-adjacent anomaly tasksAlgorithm Comparison: 2025–2026
| Algorithm | Data Type | Needs Labels | Scalability | Interpretability | Best Use Case |
|---|---|---|---|---|---|
| Isolation Forest | Tabular | No | High | Medium | General-purpose outlier detection |
| One-Class SVM | Tabular | Partial | Low | Medium | Small, controlled datasets |
| DBSCAN | Tabular/Spatial | No | Medium | High | Clustering-based outlier detection |
| Autoencoder | Any | No | High | Low | Complex pattern anomalies |
| LSTM | Time-series | No | Medium | Low | Sequential/temporal anomalies |
| Transformer-based | Time-series | Optional | High | Low | Long-range temporal dependencies |
Where Anomaly Detection Is Being Used Right Now
Cybersecurity Detecting unusual network behavior, unauthorized access patterns, and zero-day exploits before they cause damage. LSTM and autoencoder-based systems are becoming standard in enterprise security operations centers.
Financial Fraud Prevention Real-time transaction monitoring at scale. Isolation Forest and gradient boosting models dominate here, often running in milliseconds on millions of transactions per day.
Industrial and Manufacturing Predictive maintenance systems that detect early signs of equipment failure — vibration anomalies, temperature spikes, pressure irregularities — before breakdowns occur. IoT sensor data feeds directly into LSTM and autoencoder pipelines.
Healthcare and Medical Monitoring Patient vital sign monitoring, ECG anomaly detection, and unusual lab result flagging. These applications require extremely high recall — missing a real anomaly in healthcare is not acceptable.
Cloud Infrastructure and Observability AIOps platforms use anomaly detection to monitor thousands of metrics simultaneously, flagging unusual latency, error rates, memory usage, and traffic patterns. This is one of the fastest-growing application areas in 2025–2026.
AI System Monitoring An emerging use case: detecting anomalies in the outputs and behavior of AI systems themselves — flagging unexpected model outputs, data drift, or degradation in prediction quality.
Modern anomaly detection systems increasingly depend on retrieval pipelines, tool orchestration, and intelligent workflow execution. Our RAG vs TAG guide explores how modern AI systems combine knowledge retrieval with tool-augmented decision-making architectures.
Modern transformer-based anomaly detection models rely heavily on long-context understanding and sequence modeling. Our Context Engineering vs Prompt Engineering article explains why context quality is becoming more important than prompt tricks in advanced AI systems.
The Biggest Challenges in Anomaly Detection
Even with all the advances, several problems remain genuinely hard.
The labeling problem Anomalies are rare by definition, which means labeled datasets are scarce. Most real-world anomaly detection has to work in an unsupervised or semi-supervised setting — which makes evaluation difficult and false positive rates hard to control.
Concept drift What’s “normal” changes over time. A system trained on last year’s traffic patterns may start misfiring when usage patterns shift. Keeping detectors current without constant retraining is an ongoing challenge.
High false positive rates In practice, many anomaly detection systems generate far more alerts than can be investigated. Alert fatigue is real, and it undermines the entire purpose of the system. Reducing false positives without increasing false negatives is one of the hardest trade-offs in the field.
Interpretability When a deep learning model flags something as anomalous, explaining why to a security analyst or a business stakeholder is often difficult. Black-box anomaly detection creates trust issues in high-stakes environments.
Multivariate complexity Real-world systems have hundreds of interrelated metrics. An anomaly might only be detectable when you look at multiple signals together — not any single one in isolation. Multivariate anomaly detection remains harder than univariate, and most deployed systems still underperform on it.
What’s Actually New in 2025–2026
A few developments are worth paying attention to specifically:
Foundation model fine-tuning for anomaly detection Pre-trained time-series models are being fine-tuned for specific anomaly detection tasks with much less domain-specific data than was previously needed. This is lowering the barrier significantly for specialized industries.
LLM-assisted anomaly explanation Large language models are being integrated into anomaly detection pipelines not to detect anomalies themselves, but to explain flagged events in plain language. A security analyst getting a natural language summary of why an event was flagged is more actionable than a raw anomaly score.
Real-time streaming anomaly detection at scale Systems built on Apache Kafka, Apache Flink, and similar streaming infrastructure are pushing anomaly detection into genuinely real-time territory — flagging issues within milliseconds of data arrival at massive throughput.
Federated anomaly detection For industries where data can’t be centralized due to privacy regulations — healthcare, finance, government — federated learning approaches are enabling anomaly detection models to be trained across distributed data without raw data ever leaving local systems.
Graph-based anomaly detection As more systems are modeled as graphs (knowledge graphs, transaction networks, infrastructure dependency graphs), graph neural network-based anomaly detection is growing rapidly. It’s particularly powerful for detecting coordinated fraud and complex attack patterns.
Which Algorithm Should You Use?
There’s no universal answer, but here’s a practical framework:
Start with Isolation Forest if you have tabular data, no labels, and need something that works well out of the box. It’s fast, scalable, and surprisingly robust.
Use autoencoders if your data is complex, high-dimensional, or doesn’t fit neatly into tabular form. They require more setup but handle harder problems.
Reach for LSTM or Transformer-based models when your data is sequential and timing matters. For long sequences or when you have access to pre-trained time-series models, Transformers are increasingly the better choice.
Consider DBSCAN when you need interpretable clustering alongside outlier detection, especially for spatial or behavioral data.
Use One-Class SVM only when your dataset is small and well-defined, and you have good clean normal-class examples to train on.
And in real production systems:
Don’t rely on a single algorithm. Ensemble approaches — combining multiple detectors and aggregating their scores — consistently outperform any individual method.
Final Thoughts
Anomaly detection has gone from a niche engineering problem to a core capability that modern systems depend on.
The algorithms are more powerful than they’ve ever been. The tools and frameworks for deploying them at scale are mature. And the business cases — from fraud prevention to infrastructure reliability to AI system observability — have never been stronger.
But the fundamentals haven’t changed.
Understanding your data matters. Knowing what “normal” means in your context matters. Choosing the right algorithm for your problem type matters.
No amount of deep learning sophistication replaces that foundation.
The teams getting the most out of anomaly detection in 2025–2026 are the ones who combine a solid understanding of the algorithms with real domain knowledge about what they’re monitoring — and who treat anomaly detection as an evolving system, not a one-time deployment.
Because the data changes. The threats change. And your detection systems need to keep up.
What is anomaly detection?
Anomaly detection is the process of identifying data points, patterns, or behaviors that deviate significantly from what is considered normal. It is used across cybersecurity, finance, healthcare, manufacturing, and infrastructure monitoring.
Which anomaly detection algorithm is best for time-series data?
LSTM-based models and Transformer-based architectures like Anomaly Transformer perform well on time-series data. For shorter sequences and edge deployment, LSTMs remain practical. For longer sequences and complex patterns, Transformer-based models are increasingly preferred.
Do anomaly detection algorithms need labeled data?
Most anomaly detection algorithms are unsupervised and do not require labeled anomaly examples. Isolation Forest, autoencoders, and DBSCAN all work without labels. Semi-supervised approaches that use some labeled normal data often improve performance.
What is the difference between point, contextual, and collective anomalies?
Point anomalies are individual data points that are unusual. Contextual anomalies are points that are normal in general but unusual given their context. Collective anomalies are groups of points that are individually normal but collectively suspicious.
What’s new in anomaly detection in 2025–2026?
Key developments include foundation model fine-tuning for domain-specific detection, LLM-assisted anomaly explanation, real-time streaming detection at massive scale, federated anomaly detection for privacy-sensitive industries, and graph neural network-based detection for complex networked systems.